May 2019
By: Pat Guinet, CIMA®
In part 1 and 2 of our 4-part series of a historical review of the markets, we arrived at 2 key conclusions:
(click here to view part 1 and part 2)
The similarities between the United States and Japan are worth considering as we look to the future and fulfill our role as your fiduciary. Could we be heading into a period something like Japan endured following 1990?
Japan experienced rapid growth following World War II as the U.S. and others helped rebuild its economy. The expansion culminated in the 1980s Japanese asset bubble, which popped in the 1990’s. Starting in 1992 the Bank of Japan (BOJ) began cutting rates and eventually reached 0% a few years later. The BOJ had two short-lived attempts at tightening (raising rates) between 2000 and 2010, neither worked to stimulate growth, and rates have never been raised since. Its policy rate has been near zero for 20 years. The BOJ has increasingly resorted to QE-like programs which had little effect. In addition, the government has tried assorted fiscal policies like infrastructure projects, deregulation, and tax cuts. The impact to its economy has been GDP growth near zero, plus or minus a few points with little to no inflation. Another challenge is their aging population. Sound familiar?
The U.S. Federal Reserve policy from 2008 to 2016 of cutting rates and QE programs has had little effect on the strength of the U.S. recovery. The European Central Bank did the same in even larger amounts than the U.S. Federal Reserve with little effect and benefit to their respective economies. We appear to be replicating Japan’s fiscal policy with rapidly growing deficit spending. In fact, there is a possibility we will be exceeding Japan. The Japanese deficit as a percentage of GDP is projected to be below 4% while the U.S. is closer to 5%. The ever-widening unfunded liabilities gap of programs like Social Security and Medicare will cause the U.S. deficit to grow even larger in the future.
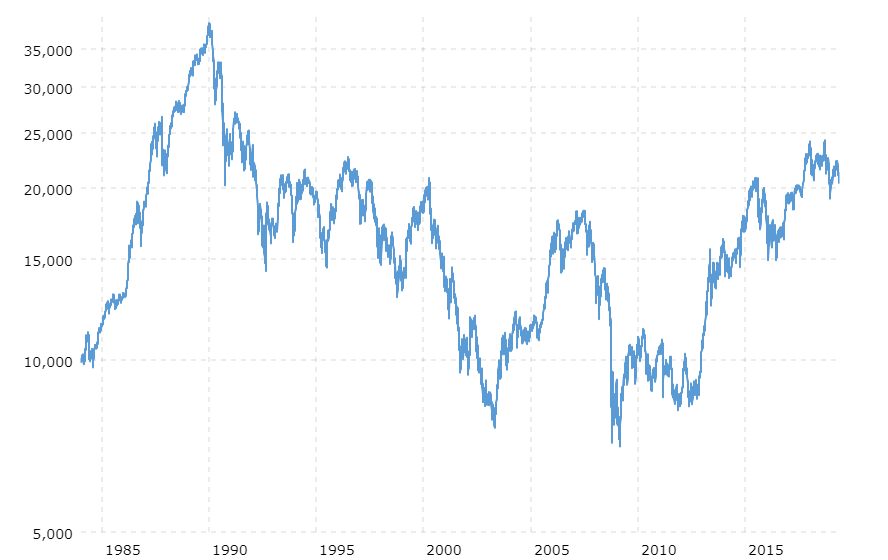
The Nikkei 225 Index from 1990 to the present has been in a secular bear market. (See historical chart below).
Nikkei 225 Index 1990 to Present
We are not sure if the U.S. is heading down the same multi-decades path as Japan with low-interest rates, increasing deficits, and low or no inflation. It is important we at least consider the possibility of this kind of investment environment. It happened to our Dow Jones Industrial Average from 1965 to 1981, and it happened “again” to Japan from 1990 to the Present. Simply thinking the market always goes up and makes new highs seems irresponsible. The magnitude to which interest rates declined in the past is highly unlikely to repeat itself. At GFP we have developed an investment platform we feel can navigate and offer flexibility whatever the future holds. We call it DRAAMS (Dynamic Risk Asset Allocation Management Sleeves). The final part of our 4 part series will discuss DRAAMS and its ability to adjust and manage risk.